US Wine Market Report 2025: Production, Consumption & Industry Data
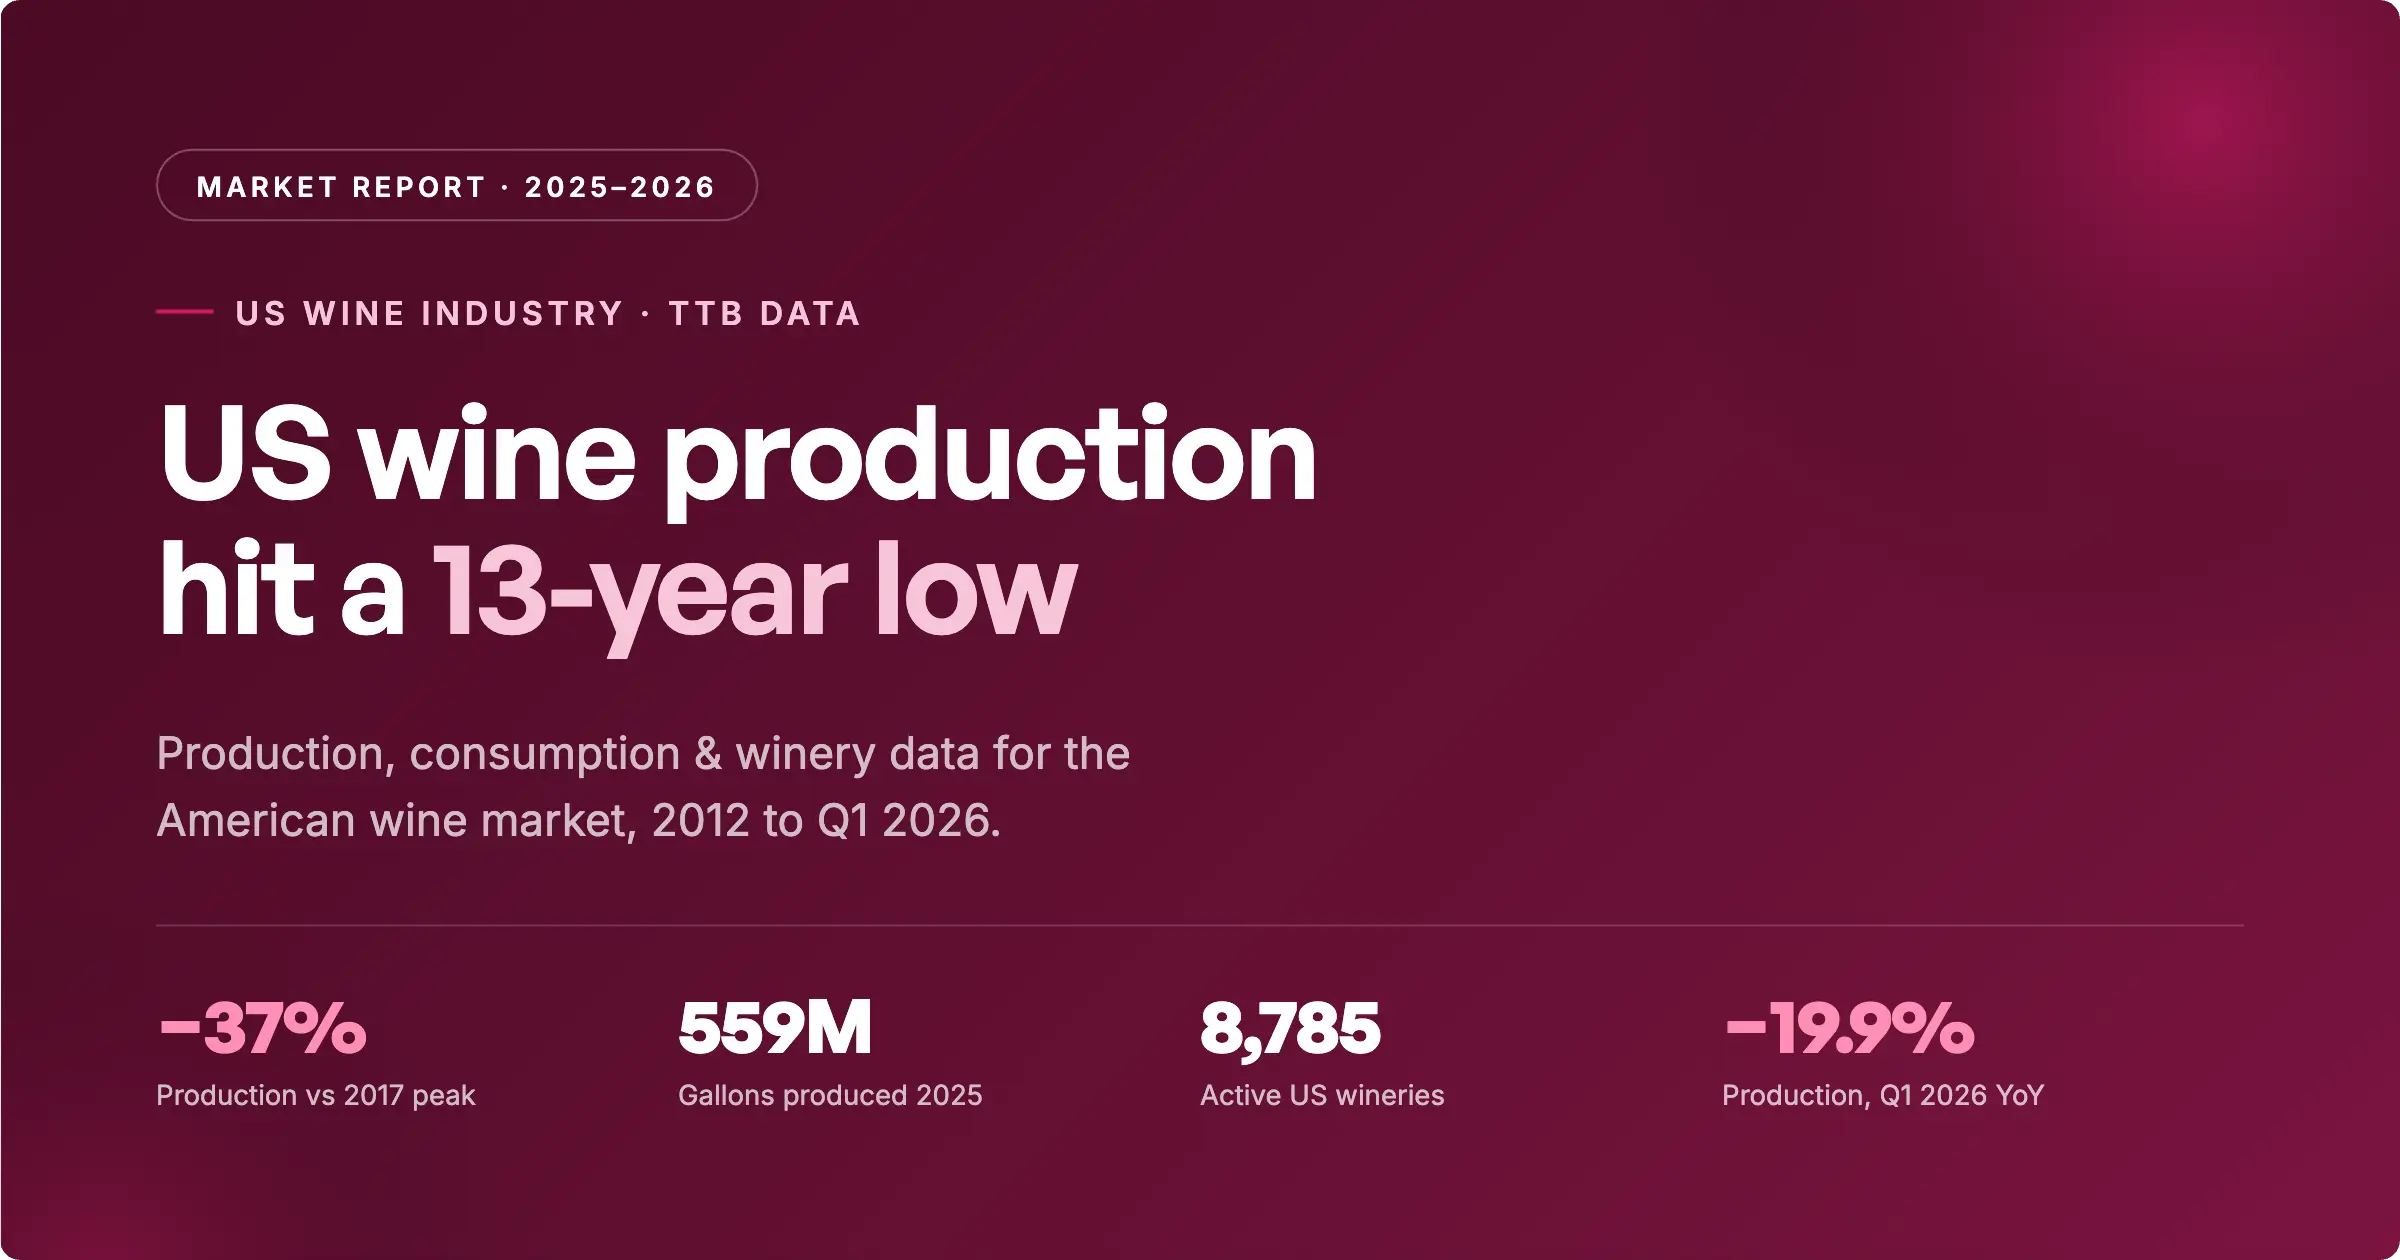
US wine production fell to 559 million gallons in 2025 — down 15% from 2024 and 37% below its 2017 peak of 890M gallons. Domestic taxable removals (the volume entering the US market) dropped to 554M gallons, the lowest in the 2012–2025 record, and the number of active US wineries fell for a second year to 8,785. Q1 2026 data confirms the decline is continuing — production is down another 19.9% year-on-year. The picture is a maturing, contracting domestic market, and a growing opening for imported wine.
- US wine production reached 559M gallons in 2025 — down 15% year-on-year and 37% below the 2017 peak of 890M gallons.
- Q1 2026 confirms the decline continues: production −19.9%, removals −6.5% and exports −16.8% versus Q1 2025.
- Domestic taxable removals fell to 554M gallons, the lowest level in the 2012–2025 record — confirming falling US wine consumption.
- The number of active US wineries dropped to 8,785, down from a 2023 peak of 9,703 — the first sustained contraction in over a decade.
- Sparkling wine production fell to 19.9M gallons, down 42% from its 2017 high.
- US wine exports halved over ten years, from ~109M gallons (2015) to 54M gallons (2025) — and 68% of what remains now ships in bulk, not bottled.
- A shrinking domestic industry and premiumising consumers create a widening opening for imported wine from Europe, South America and Oceania.
Is the US wine market growing or shrinking?
For most of the 2010s, US wine production held between 810M and 890M gallons a year. That stability broke after 2020: production slid to ~770M gallons through the early 2020s, then fell steeply — down to 655M gallons in 2024 and 559M gallons in 2025. This is not a one-year weather effect; it tracks a multi-year decline in domestic wine consumption, an aging core consumer base, and competition from spirits, cannabis and no/low-alcohol drinks.
Crucially, the volume of wine actually entering the US market — measured by taxable removals — has fallen alongside production, from a peak of 743M gallons in 2020 to 554M gallons in 2025. That is a 25% drop in five years. Domestic producers are making less because Americans are drinking less domestic wine.
US wine production trend, 2012–2025
The chart below shows total US wine production (all wine, sparkling and hard cider combined) for every year from 2012 to 2025, based on TTB operational reports.
US domestic wine market and consumption
Taxable removals measure the wine that actually enters US commerce. Unlike production (which can be stockpiled), removals track real demand. The trend is unambiguous: after peaking at 743M gallons in 2020, removals have fallen every year since. Of the 554M gallons removed in 2025, 536M was bottled and just 19M was bulk — confirming that packaged, retail-ready wine dominates the domestic channel.
| Year | Production | Domestic removals | Wineries | Exports |
|---|---|---|---|---|
| 2020 | 770M | 743M | 9,028 | 97M |
| 2021 | 774M | 715M | 9,414 | 88M |
| 2022 | 775M | 670M | 9,664 | 77M |
| 2023 | 771M | 631M | 9,703 | 61M |
| 2024 | 655M | 595M | 9,449 | 69M |
| 2025 | 559M | 554M | 8,785 | 54M |
Source: TTB · Wine · Full year 2020–2025 · Volumes in wine gallons
Q1 2026 — latest data
The most recent TTB monthly data available covers Q1 2026. Every core metric is down year-on-year: production −19.9%, domestic taxable removals −6.5%, exports −16.8%, and sparkling production −17.3%. Wine stocks held on hand at the end of March 2026 were also lower (931M gallons vs 1,011M a year earlier, −7.4%), meaning the industry is not simply building inventory — it is producing and shipping less across the board.
| Metric (Q1, Jan–Mar) | Q1 2025 | Q1 2026 | YoY |
|---|---|---|---|
| Wine production | 106.4M | 85.3M | −19.9% |
| Domestic taxable removals | 137.2M | 128.3M | −6.5% |
| Exports | 16.4M | 13.6M | −16.8% |
| Sparkling production | 6.3M | 5.2M | −17.3% |
| Stocks on hand (end Mar) | 1,011M | 931M | −7.4% |
Source: TTB · Wine · Monthly Statistical Report · Q1 = January–March · Wine gallons
For wine exporters, the read-through is consistent: domestic US wine supply keeps shrinking through 2026, leaving room on shelves and lists for imported wine — while US wine's own export presence contracts further.
What kind of wine does the US produce?
US wine output is overwhelmingly still table wine. In 2025, low-ABV wine (16% alcohol and under — the category that includes most table wine) made up the large majority of production, with sparkling wine, hard cider and higher-ABV wine as much smaller segments.
Source: TTB · Wine · Production by statistical detail · 2025 · Wine gallons
Sparkling wine is a notable weak spot: at 19.9M gallons, domestic sparkling output is down 42% from its 2017 peak of 34.6M gallons. As US consumers continue trading up to Champagne, Prosecco and Cava, this is one of the clearest gaps that imported sparkling wine is filling.
Hard cider tells a similar story of a segment past its peak: US cider production grew rapidly from 5.6M gallons in 2012 to a high of 29.4M gallons in 2023, then fell back to 21.7M gallons in 2025 as the early cider boom cooled.
How many wineries are there in the US?
The number of US wine industry members (bonded wineries and taxpaying premises) grew almost every year from 6,498 in 2012 to a peak of 9,703 in 2023 — a decade of continuous expansion driven by small and boutique producers. That growth has now reversed: the count fell to 9,449 in 2024 and 8,785 in 2025.
The two-year loss of roughly 900 wineries is the first sustained contraction in the dataset. It signals that the long boom in small US wineries has peaked, with margin pressure, falling consumption and rising costs forcing consolidation and closures — particularly among the smallest producers.
US wine exports
US wine exports — measured as tax-free removals for export — have fallen by roughly half over the last decade, from about 109M gallons in 2014–2015 to 54M gallons in 2025. A strong dollar, retaliatory tariffs, softer demand in key markets like the EU and China, and the domestic supply squeeze have all weighed on export volume. In 2025 exports fell 22% year-on-year, the sharpest single-year drop in the series.
The composition of those exports has shifted just as dramatically. In 2015, the US exported 63.8M gallons of bottled wine and 45.0M gallons of bulk — bottled led. By 2025, bottled exports had collapsed to just 17.6M gallons while bulk held at 36.7M, meaning 68% of US wine exports are now shipped in bulk rather than in branded, finished bottles. The US is increasingly a supplier of low-value bulk wine to be bottled abroad, not a premium bottled-wine exporter.
| Year | Bottled exports | Bulk exports | Total | Bulk share |
|---|---|---|---|---|
| 2015 | 63.8M | 45.0M | 108.9M | 41% |
| 2020 | 34.4M | 62.1M | 96.5M | 64% |
| 2023 | 29.3M | 31.7M | 61.0M | 52% |
| 2024 | 27.7M | 40.9M | 68.6M | 60% |
| 2025 | 17.6M | 36.7M | 54.2M | 68% |
Source: TTB · Wine · Tax Free Withdrawals For Export · Wine gallons · 2015–2025
What this means for wine importers and exporters
A contracting domestic industry does not mean a contracting wine market — it means a shifting one. Americans are drinking less wine overall, but the wine they do buy is increasingly premium and, increasingly, imported. Several signals point the same way:
- Falling domestic supply — production down 37% from peak — leaves shelf and list space that imported wine can capture, especially in mid-premium and premium tiers.
- Weak domestic sparkling (down 42%) is already being met by Prosecco, Champagne and Cava — a clear, quantified opening for European sparkling exporters.
- Winery closures concentrate volume among fewer, larger domestic players, making importers and distributor portfolios more important for variety and differentiation.
- Premiumisation — consumers trading up rather than drinking more — favours distinctive imported wines with a story, origin and certification.
For exporters targeting the US, the practical task is reaching the importers, distributors and retail buyers who control access to the market. That is exactly what the BestWineImporters database is built for.
Frequently asked questions
Sources and methodology
All production, removals, winery-count and export figures are drawn from the US Department of the Treasury, Alcohol and Tobacco Tax and Trade Bureau (TTB) Monthly Production and Operations Statistical Report and Annual State Statistical Report for Wine, full years 2012–2025, in wine gallons. "Production" is the Production category total; "domestic removals" is Taxable Withdrawals category total; "exports" is Tax Free Withdrawals For Export; "wineries" is the Number of Industry Members. State-level figures are not used here because TTB reports by bonded premises rather than by where grapes are grown, which distorts state comparisons. Figures may be revised as late or amended operational reports are filed. Data reviewed June 2026.