
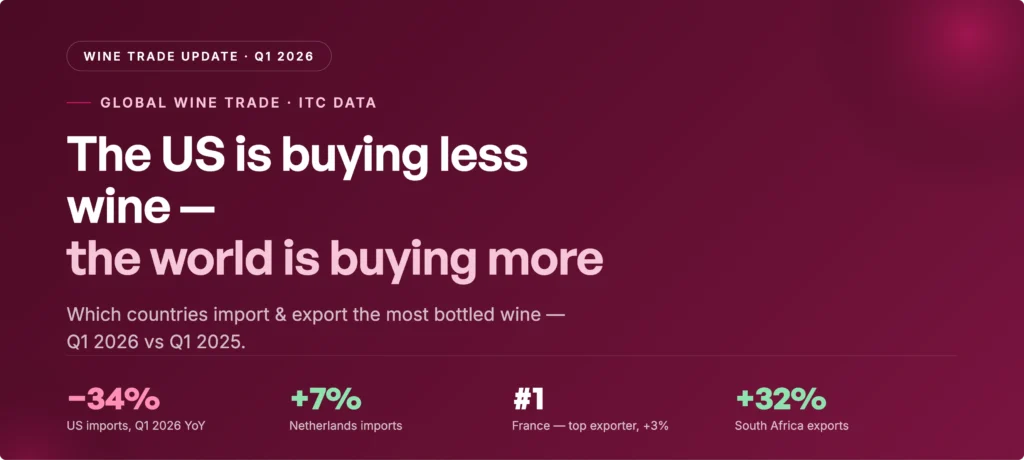
Comparing the first quarter of 2026 with the same period in 2025, the global bottled-wine market split in two. The United States — the world's largest importer — collapsed 34% year-on-year, from $1.38B to $911M. Almost every other major buyer grew: the UK (+2%), Germany (+5%), Netherlands (+7%) and Hong Kong (+9%). On the supply side France still leads and grew +3%, while South Africa was the fastest-rising exporter (+32%) and US exports fell −25%. Here is the full Q1 2025 → Q1 2026 comparison, using ITC Trade Map data.
- The United States collapsed 34% year-on-year — from $1.38B to $911M in a single quarter — by far the biggest move in the market.
- Almost every other major importer grew: Hong Kong (+9%), Netherlands (+7%), Germany (+5%), Japan (+4%), China (+4%), UK (+2%).
- France still leads exports and grew +3% ($1.78B in Q1 2026); Italy held flat (−0.3%).
- South Africa was the fastest-rising exporter (+32%), followed by Germany (+8%) and Spain (+5.5%).
- The US is weak on both sides: imports −34% and exports −25% — the standout loser of the quarter.
- The takeaway for exporters: demand didn't disappear, it moved. The growth is in Northern Europe and Asia, not the US.
What changed in Q1 2026?
This update covers bottled still wine — customs code HS 220421: wine of fresh grapes, incl. fortified wines, and grape must whose fermentation has been arrested by the addition of alcohol, in containers of ≤ 2 litres (excl. sparkling wine) — the largest category in international wine trade. All figures are import/export values in US dollars from ITC Trade Map, and every comparison here is the same quarter, one year apart — Q1 2026 vs Q1 2025 — so seasonal effects cancel out and the numbers reflect real change in demand and supply.
We publish this comparison each quarter. This edition covers Q1; the next will add Q2 2026 vs Q2 2025 as the data is released, building a running picture of where wine demand is heading.
Wine importers: Q1 2025 vs Q1 2026
The chart compares each major importer's Q1 2025 value (lighter bar) with Q1 2026 (darker bar). The US bar is the only one that shrinks meaningfully — every other big market is flat or higher.
| Importer | Q1 2025 | Q1 2026 | Change |
|---|---|---|---|
| 🇺🇸 United States | $1,381M | $911M | −34.0% |
| 🇬🇧 United Kingdom | $585M | $597M | +2.0% |
| 🇩🇪 Germany | $411M | $433M | +5.3% |
| 🇨🇦 Canada | $372M | $379M | +1.7% |
| 🇳🇱 Netherlands | $283M | $303M | +7.0% |
| 🇨🇳 China | $290M | $301M | +3.9% |
| 🇨🇭 Switzerland | $230M | $235M | +2.3% |
| 🇯🇵 Japan | $198M | $205M | +3.8% |
| 🇭🇰 Hong Kong | $196M | $213M | +8.9% |
| 🇧🇪 Belgium | $189M | $193M | +2.0% |
Source: ITC · HS 220421 · Q1 2026 vs Q1 2025.
The US import collapse
The chart tracks US imports quarter by quarter. The Q1-to-Q1 comparison (highlighted points) makes the scale of the fall clear.
This matches what domestic data already showed: US wine consumption is softening, and importers are ordering more conservatively. For exporters, it is a signal to diversify beyond a single US-centric strategy — the growth in 2026 is in the UK, Germany, the Netherlands and parts of Asia, not the US.
Wine exporters: Q1 2025 vs Q1 2026
On the supply side the ranking barely moved — France and Italy remain far ahead of everyone else — but the year-on-year changes tell the story: France edged up, South Africa surged, and the US fell sharply.
| Exporter | Q1 2025 | Q1 2026 | Change |
|---|---|---|---|
| 🇫🇷 France | $1,723M | $1,779M | +3.2% |
| 🇮🇹 Italy | $1,316M | $1,312M | −0.3% |
| 🇪🇸 Spain | $439M | $463M | +5.5% |
| 🇨🇱 Chile | $275M | $278M | +1.4% |
| 🇦🇺 Australia | $223M | $206M | −7.7% |
| 🇳🇿 New Zealand | $207M | $208M | +0.4% |
| 🇵🇹 Portugal | $201M | $209M | +4.2% |
| 🇩🇪 Germany | $189M | $203M | +7.8% |
| 🇺🇸 United States | $191M | $143M | −25.2% |
| 🇦🇷 Argentina | $124M | $121M | −2.5% |
| 🇿🇦 South Africa | $86M | $113M | +31.6% |
Source: ITC · HS 220421 · Q1 2026 vs Q1 2025.
Who's rising and who's falling
Comparing Q1 2026 with Q1 2025 reveals which trade flows are strengthening and which are weakening.
Rising
- South Africa (exports +32%) — by far the fastest-growing major exporter, gaining share in value-focused segments.
- Germany (exports +8%, imports +5%) — growing on both sides of the ledger.
- Hong Kong (imports +9%) and the Netherlands (imports +7%) — re-export and distribution hubs absorbing volume the US is releasing.
- Spain (exports +5.5%) and Portugal (+4.2%) — steady European gains.
Falling
- United States (imports −34%) — the single biggest shift in the market.
- United States (exports −25%) — US wine is losing ground abroad as well as at home.
- Australia (exports −8%) — the weakest of the big New World suppliers.
What this means for wine exporters
The data points to a clear strategic picture for anyone selling wine internationally:
- Don't over-index on the US. It is still the biggest single market, but it is contracting fast. Treat it as one market among several, not the default.
- Northern Europe is the stable core. The UK, Germany, Netherlands, Switzerland and Belgium are large and growing steadily — lower risk, consistent demand.
- Watch the fast movers. Hong Kong and the Netherlands are absorbing volume; markets like these reward exporters who arrive early with the right importer relationships.
- Match origin to channel. France and Italy dominate premium; Spain, Chile, South Africa and Argentina compete on value — know which tier your wine fits and target buyers accordingly.
In every one of these markets, the practical bottleneck is the same: reaching the importers, distributors and retail buyers who actually control shelf and list access. That is exactly what the BestWineImporters database is built for — verified buyer contacts across 168 countries, in every market named in this report.
Frequently asked questions
Sources and methodology
All trade figures are drawn from ITC, based on national customs statistics for HS 220421 (wine of fresh grapes, incl. fortified wines, and grape must whose fermentation has been arrested by the addition of alcohol, in containers of ≤ 2 litres, excl. sparkling wine — i.e. bottled still wine), reported in US dollars. Every comparison in this update is the same quarter one year apart — Q1 2026 (January–March 2026) versus Q1 2025 — so seasonal effects cancel out. Country rankings reflect the largest exporters and importers by value in the dataset. Quarterly customs data may be revised as national statistics are updated, and re-export hubs (such as the Netherlands, Hong Kong and Singapore) can overstate final-consumption demand. We publish this comparison each quarter; the next edition will add Q2 2026 vs Q2 2025. Data reviewed July 2026.